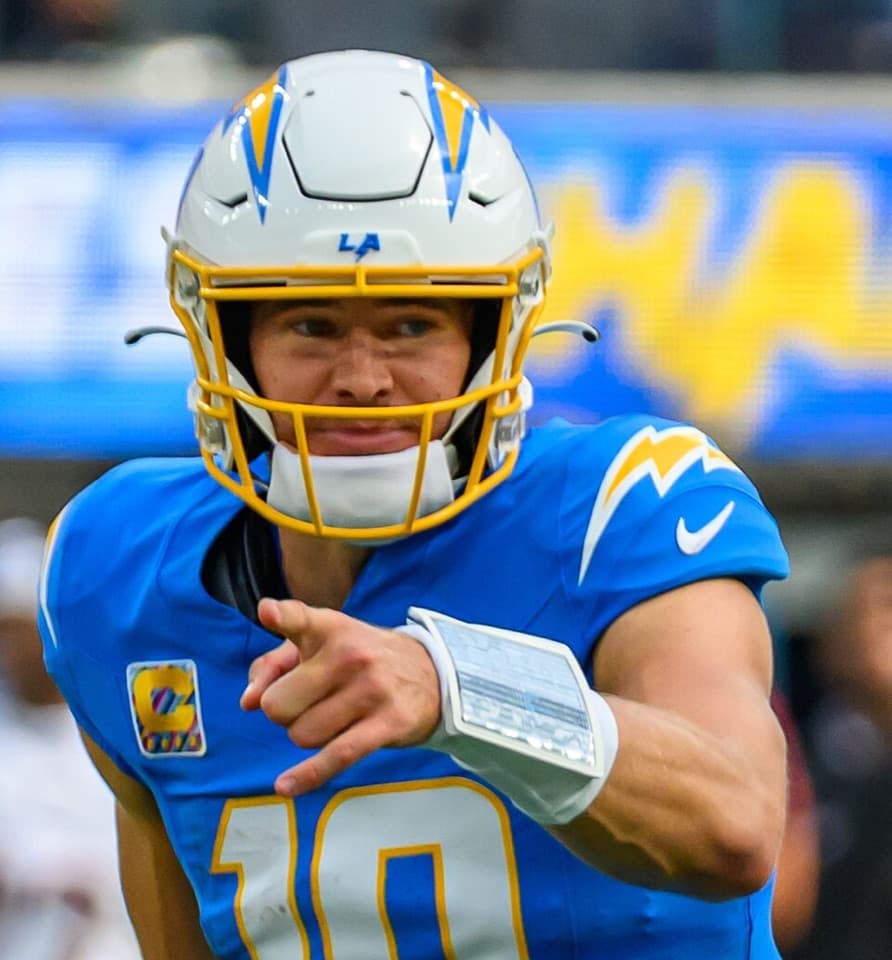
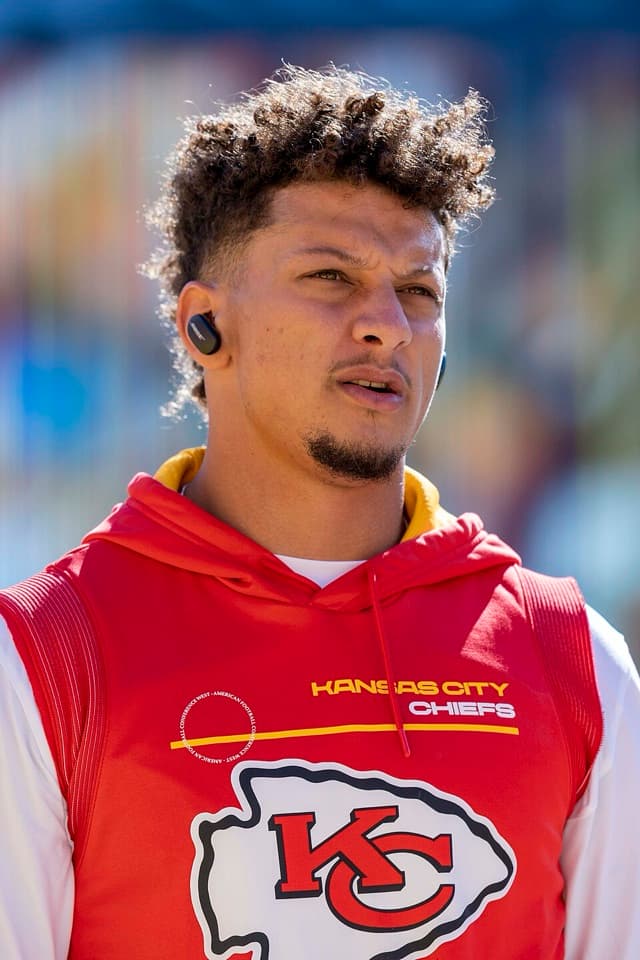
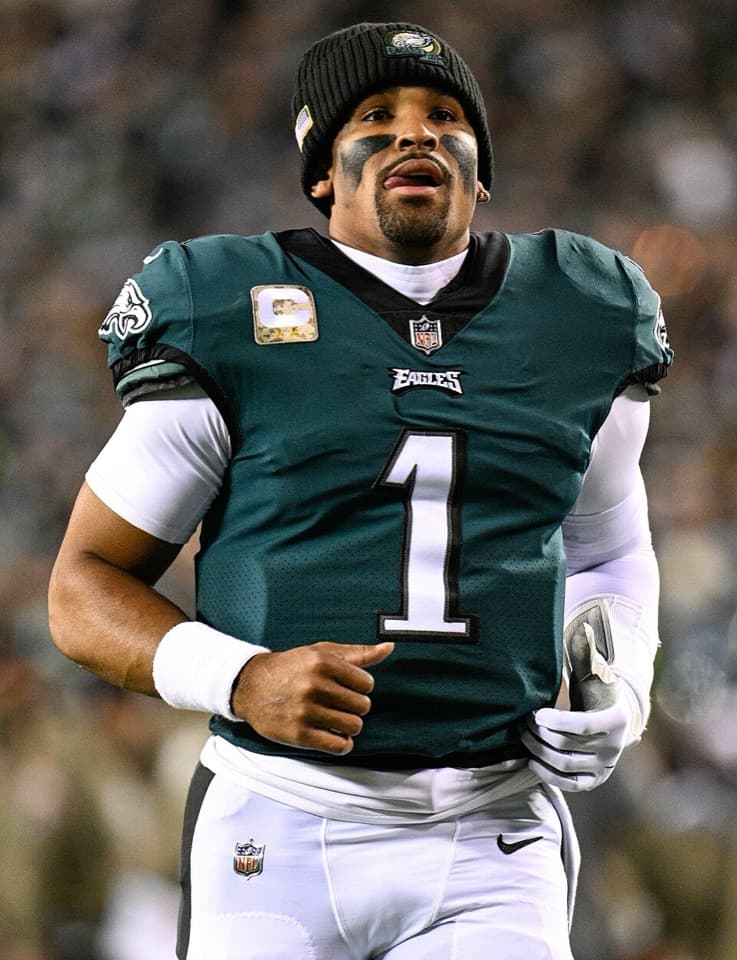
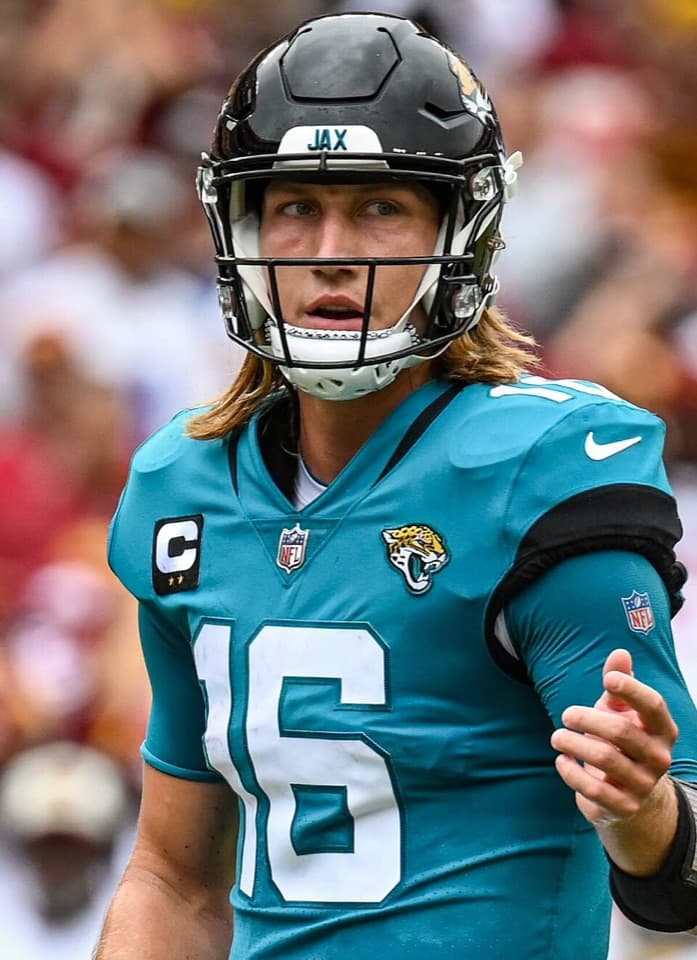
Start with comparable evidence.
Both players use the same release, format, league size, and composite scale. Rank is context, while the percentage gap measures the trade difference.
Compare 132 players across dynasty Superflex, dynasty 1QB, tight end premium, and redraft—then measure the exact effect of standard, half-PPR, full-PPR, or six-point passing touchdowns. Every answer updates from the same validated market release.
Both players use the same release, format, league size, and composite scale. Rank is context, while the percentage gap measures the trade difference.
The scoring model uses observed per-game profiles and subtracts same-position replacement. Players do not receive generic PPR or passing-TD bumps.
Injuries, lineup need, manager preference, and future outcomes remain outside the score. Close values should be treated as a tier, not false precision.
Matchups were selected from meaningful current value neighborhoods, not generated as every possible name combination. Every pairing must present a real format, scoring, timeline, or roster-construction decision.
 Josh Allen
 Drake Maye
 Lamar Jackson
 Caleb Williams
 Jayden Daniels
 Joe Burrow
 Justin Herbert
 Patrick Mahomes
 Jalen Hurts
 Trevor Lawrence
 Bo Nix
 Brock Purdy
 Baker Mayfield
 Jared Goff
 Cam Ward
 C.J. Stroud
 Dak Prescott
 Jordan Love
 Geno Smith
 Jacoby Brissett
 Aaron Rodgers
 Kirk CousinsPatrick MahomesJalen HurtsJoe BurrowLamar JacksonCaleb WilliamsJayden DanielsDrake MayeLamar JacksonC.J. Stroud
 Kyler Murray
 Tyler ShoughCam Ward
 Bryce Young
 Sam Darnold
 Matthew StaffordDak PrescottJoe BurrowCaleb WilliamsKyler MurraySam Darnold
 Bijan RobinsonJahmyr GibbsAshton JeantyOmarion HamptonJames CookKenneth WalkerChristian McCaffreyChase BrownBreece HallSaquon BarkleyDavid MontgomeryJosh JacobsRhamondre StevensonJaylen WarrenZach CharbonnetBlake CorumChuba HubbardJ.K. DobbinsKyle MonangaiTyler AllgeierTony PollardKenny GainwellJordan MasonRachaad WhiteChris RodriguezBrian RobinsonBraelon AllenKeaton MitchellAaron JonesAlvin KamaraBraelon AllenTank BigsbyKeaton MitchellTyjae SpearsAaron JonesBrian Robinson
 Quinshon JudkinsBreece HallJavonte WilliamsKyren WilliamsDerrick HenrySaquon BarkleyDerrick HenryChristian McCaffrey
 Cam SkatteboBucky IrvingBucky IrvingTravis EtienneTravis EtienneTreVeyon HendersonD'Andre SwiftJosh JacobsRJ HarveyBhayshul TutenAshton JeantyBijan RobinsonJahmyr GibbsAshton JeantyChase BrownKenneth WalkerTank BigsbyBrian RobinsonAaron JonesBraelon AllenBlake CorumJaylen WarrenBucky IrvingJavonte WilliamsJa'Marr ChaseJaxon Smith-NjigbaPuka NacuaAmon-Ra St. BrownJustin JeffersonMalik NabersCeeDee LambDrake LondonTetairoa McMillanEmeka EgbukaGeorge PickensChris OlaveNico CollinsGarrett WilsonLadd McConkeyDeVonta SmithDavante AdamsMike EvansXavier WorthyQuentin JohnstonCourtland SuttonStefon DiggsJalen CokerRashid ShaheedDeebo SamuelStefon Diggs
 Malik WashingtonDontayvion WicksTank DellDontayvion WicksRashee RiceZay FlowersZay FlowersLuther BurdenA.J. BrownJaylen WaddleTee HigginsRome OdunzeMarvin Harrison JrJameson WilliamsBrian ThomasParker WashingtonMatthew GoldenJordan Addison
 Alec PierceJosh DownsPuka NacuaJustin JeffersonCeeDee LambMalik NabersDrake LondonGeorge PickensNico CollinsTetairoa McMillanChris OlaveEmeka EgbukaPuka NacuaJaxon Smith-NjigbaDeVonta SmithZay FlowersJaylen WaddleTee HigginsParker WashingtonJameson WilliamsAdonai MitchellMalik WashingtonDeebo SamuelTre TuckerNico CollinsChris OlaveLadd McConkeyEmeka EgbukaRome OdunzeMarvin Harrison JrBrock BowersTrey McBrideColston LovelandTyler WarrenTucker KraftHarold FanninSam LaPortaKyle PittsDalton KincaidGeorge KittleIsaiah LikelyKyle PittsJake FergusonDalton KincaidJake FergusonDallas GoedertBrenton StrangeAJ BarnerJuwan JohnsonJake FergusonMichael MayerAJ BarnerGeorge KittleSam LaPortaDalton KincaidKyle PittsTyler WarrenSam LaPortaSam LaPortaHarold FanninTucker KraftKyle PittsDallas GoedertJuwan JohnsonTucker KraftSam LaPorta
If the value gap is less than roughly five percent and stays small across formats, the evidence does not support demanding a large add. Choose for roster need, timeline, and your own risk tolerance. The calculator remains useful for balancing a full package.
Audit the model →Start with the dynasty market that matches your quarterback format, compare the value gap as a percentage rather than rank alone, and then check the scoring-specific table. A small gap means the players are trade peers; it does not create a precise required add.
Yes. Fantasy Trade Target recalculates each player from an observed per-game scoring profile and compares the change with same-position replacement. That can widen, narrow, or occasionally reverse a baseline value gap.
No. The model uses each quarterback’s observed passing touchdown rate and subtracts the change for a replacement-level quarterback. It does not apply the same blanket multiplier to every QB.
No. The higher current market value is the baseline answer, but 1QB scarcity, redraft horizon, reception scoring, and tight end premium can change the gap. Roster construction and risk preference still sit outside the model.