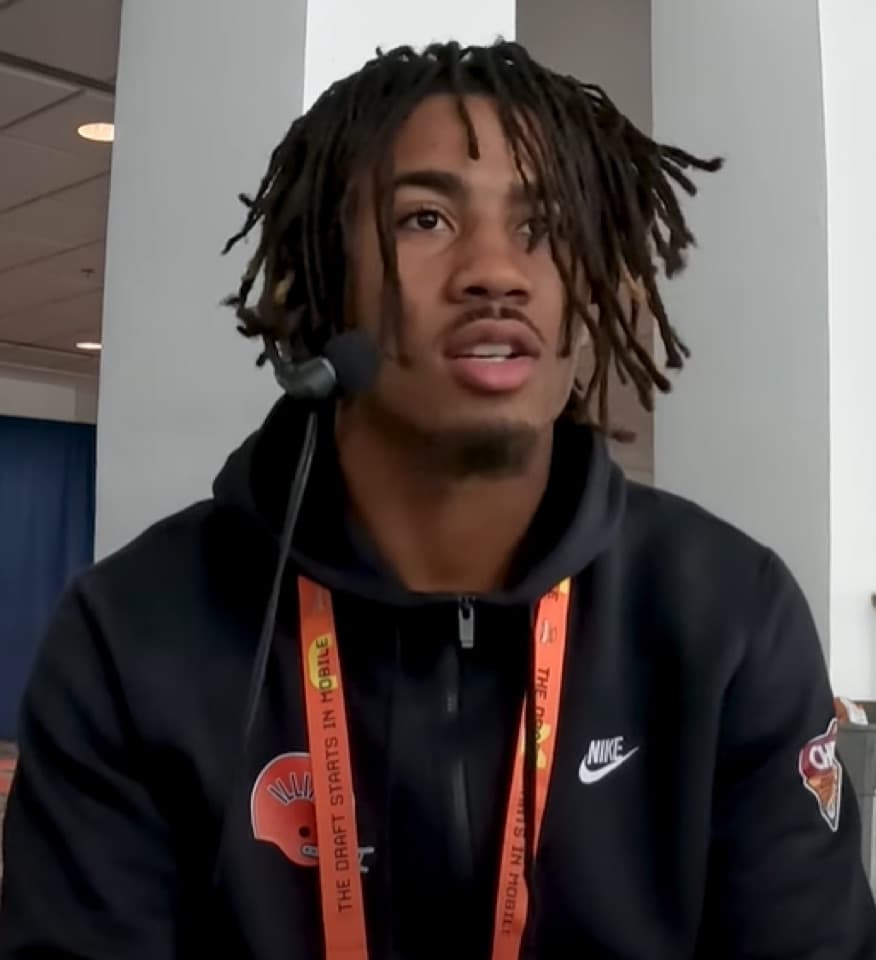
What is Pat Bryant worth in dynasty? Pat Bryant is worth 185 on the current dynasty Superflex market scale, ranking No. 171 overall and WR69 at the position.
Pat Bryant's dynasty case combines receiving opportunity with a longer positional value window; compare the usage profile with similarly priced players before making an offer. This is a transparent market reference—not a projection or an instruction to accept a trade without considering your roster.
FTT // PLAYER FILE WR DEN Image: Tennessee Titans · CC BY 3.0 · Wikimedia Commons Current price // four formats
One player. Different markets. League format changes scarcity. These values come from the same daily composite feed so the comparisons stay on one scale.
Dynasty Superflex 185
#171 overall · WR69
Dynasty 1QB 240
#159 overall · WR67
Superflex TEP 185
#177 overall · WR69
Redraft 1QB —
Not currently ranked
Production // latest season What happened on the field.
Fantasy points/game Not available
Consistency grade F
Targets/game Not available
Receptions/game Not available
Receiving yards/game Not available
Catch rate Not available Season and consistency figures are descriptive historical results. They are not forward projections.
Usage // 2025 How the role created it.
Target share 12.7%
Air-yards share 19.0%
WOPR 0.3
Average target depth 8.3 Advanced usage describes opportunity and role. Missing metrics remain visibly unavailable.
NFL game log // verified results
Official-box-score-style weekly results, fantasy points in all three reception settings, and offensive snap participation. These are historical outcomes, not next-game projections.
Roster status Reserve DEN · Week 7 Listed role WR No. 13 · 1 years experience Game designation No designation listed Ankle · Week 5 Practice report Did Not Participate In Practice Ankle Availability week Game status Practice Listed injury Week 5 No game designation Did Not Participate In Practice Ankle
Season Games Standard PPG Half PPR PPG PPR PPG Off. snaps/game 2026 4 5.7 6.9 8.0 35.5 2025 13 3.4 4.6 5.8 35.2
Game Volume Standard Half PPR PPR Snap share 2026 · Week 4 DEN vs. SF 3 touches · 3 targets · 47 scrimmage yards · 0 TD 4.7 6.2 7.7 36% 2026 · Week 3 DEN vs. LAR 2 touches · 2 targets · 44 scrimmage yards · 1 TD 12.4 13.4 14.4 70% 2026 · Week 2 DEN vs. JAX 1 touches · 1 targets · 16 scrimmage yards · 0 TD 1.6 1.6 1.6 66% 2026 · Week 1 DEN vs. KC 4 touches · 6 targets · 42 scrimmage yards · 0 TD 4.2 6.2 8.2 59% 2025 · Week 18 DEN vs. LAC 4 touches · 5 targets · 31 scrimmage yards · 0 TD 3.1 5.1 7.1 66% 2025 · Week 16 DEN vs. JAX 5 touches · 8 targets · 42 scrimmage yards · 0 TD 4.2 6.7 9.2 64% 2025 · Week 14 DEN vs. LV 4 touches · 4 targets · 32 scrimmage yards · 0 TD 3.2 5.2 7.2 47% 2025 · Week 13 DEN vs. WAS 3 touches · 7 targets · 42 scrimmage yards · 0 TD 4.2 5.7 7.2 70% 2025 · Week 11 DEN vs. KC 5 touches · 6 targets · 82 scrimmage yards · 0 TD 8.2 10.7 13.2 56% 2025 · Week 10 DEN vs. LV 1 touches · 2 targets · 43 scrimmage yards · 0 TD 4.3 4.8 5.3 49%
Data from nflverse , licensed CC BY 4.0 . Updated Oct 25, 2026, 7:22 PM ET. Sources and field limits .
Comparable market tier Players priced nearby. Closest rookie-pick equivalents Draft capital on the same scale. 2028 Pick 3.05 mid 183
2027 Pick 3.09 late 182
2027 Pick 3.10 late 179
These are the nearest individual picks by value, not a claim that another manager will accept a one-for-one offer.
Data note: Market and profile data updated Oct 25, 2026, 7:21 PM ET. See sources, licensing, and freshness . Fantasy Trade Target applies its published calculator methodology in release ftt-20261025T231550Z . Accepted-trade distributions and league-specific lineup evidence are not yet included.